Overview
of the DNA Microarray Service
In what follows, a set of well-defined steps will be outlined that when perform together (user and core) will yield an interpretable microarray study. Through the user interface, an investigator should experience this process as a single interaction with the core staff (Figure 1). However in the background three components of the core will be functioning based on the experiences we have accumulated over the life of the LMT facility. The underlying principle is that a properly performed microarray experiment is very expensive in financial and personnel resources. For this experimental strategy to have practical use, it must be designed to maximize the likelihood of identifying meaningfully regulated genes and to associate these changes with the biology of the experimental model.
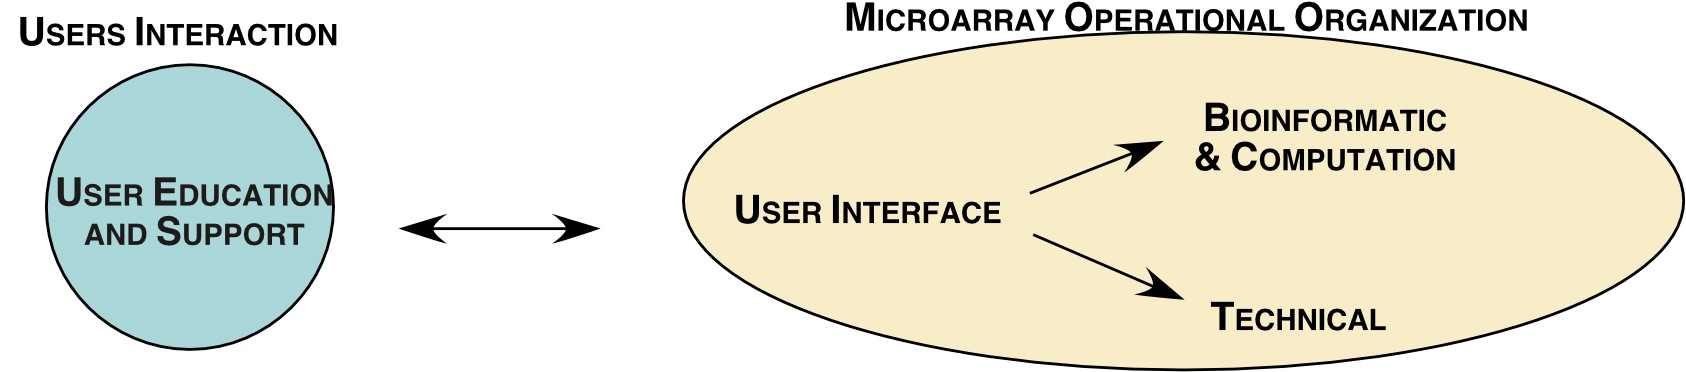
Figure 1. The conceptual frame work of how the microarray core interacts with the user to provide an intelligently designed and interpretable microarray experiment. Each component of this relationship is discussed in section b.
Technical-Most of the critical steps in spotting slides and preparing them for two color fluorescent cDNA hybridization are well established. Crucial to the low background and full dynamic range of our slide reader was an mRNA amplification step (Arturis and aminoallyl labeling) and a microfluidics chamber (Biomicro Maui) for uniform hybridization. A problem that we have come to appreciate is the loss of environmental control during the hot and humid summer months leads to unpredictable high background and low signal intensity. The institution has been helpful in resolving this problem by providing an environmentally controlled room containing HEPA filters (dust), charcoal filters (ozone) and auxiliary cooling and dehumidification. The room contains our microspotter, Maui hybridization chambers and the slide reader so that all the steps requiring fluoresence are done within this environment.
The murine 16K chip went into production in January 05 and it has proven to be a major improvement in breadth of expression of locus link genes .The gene set is printed on our in house produced polylysine slides with 2 replicas per slide. Approximately 1 in 5 spots is a control (A.thaliana) clone and many genes have two non-overlapping probes. Figure 2 illustrates the density of the spotted array and the type of hybridization that it is producing. A 21K chip is scheduled for release in the fall of 2005.
With institutional funding, the core acquired a full Affymetrix consisting of the GeneChip; high resolution Scanner 3000 with Fluidics 450 Workstation and hybridization oven. The staff is trained and has produced experimental data that indicates close concordance between the Affy and cDNA platforms (see below).
Bioinformatic and computation; As a result of weekly meetings with our bioinformatics colleagues Storrs, a strategy has evolved that is a major advance in sophistication over the excel based ad hoc analysis. An interface has been developed (array utilities, AU) in which raw intensity data from the slide scanner and the experimental design file is submitted to an automated pipeline that prepares the data for analysis by various packages within Bioconductor. The Java scripts that carryout this task provide an interface with the primary source of open source programs written by the academic community in the computer language of R. Currently integrated programs that utilize this rich source of computational programs are expensive commercial offerings that require recurring licensing fees and use unclear data processing algorithms. The importance of this effort is that we understand and control every step of the process and can modify or add to the computational flow as needed.
After many iterations of our data flow process, we have currently settled on a data process within the LIMMA suite that performs a modified background correction and intra slide normalization followed by a inter slide normalization for the data that will be subjected to our 3 t-statistical programs, Semiparametric Hierachial Empirical Bayesian Analysis (SPHEB, [9]), Significance Analysis for Microarrays (SAM, [10]) and LIMMA t test. However data destined to the R/MAANOVA package in Bioconductor only receive background correction. Both fixed and mixed model MAANOVA has been implemented in part because our computational pipeline has access to a multimode computer bank for distributed computation. The results of this exercise is archived in a Oracle database for highly structured querying and is returned to the microarray staff for deposition in a Filemaker 7 database (see next) optimized for user interaction.
The bioinformatics meeting also discusses clustering, annotation and pathway strategies for interpreting gene sets identified by our statistical test as being meaningfully regulated. These techniques for understanding and interpreting the biological meaning of a microarray experiment will be available to our user base through user meetings (see below).
User Interactive ; This component of the core is designed to make the technology and computational skills of the LMT to be an accessible and successful experience for the user base. Our initial steps with the users indicated that a more formalized process was required so that expectations were realistic, clearly defined and ultimately achieved (see figure 3).
The first step in the process is called the contract. An individual considering a microarray experiment meets with Dr. Krueger to outline the experimental objectives of their model system. A plan is developed that reflects the limitations of the model, the number of replications (biological and technical) that need to be performed and the design model (reference vs loop) that will be best for statistical analysis. Other considerations are cost, scheduling and the platform (cDNA or Affy or both). The details of the plan, including an invoice of the costs, is posted to a secure web site for the user and PI to review and approve.
The second step is initiated when the RNA samples are delivered to the core. The technician obtains the biological details of the experiment, document the quality of the RNA and enter the information into our Laboratory Information Management System (LIMS) program. The program has scripted entry fields that comply with MIAME standards. Assuming the RNA meets our requirements for quality (260/280 and 28S/18S ratios), the samples are processed for analysis. The technical steps are recorded in LIMS as the samples are processed. The final technical step is the processing of raw intensity data through the AU pipeline.
Presenting the results of the analysis is the next step in the interaction. All of the 25 plus files and 24 graph images that come from the AU pipeline are loaded into a database written in Filemaker 7. This program is housed on a Apple G5 server that can be accessed though the institutional network at work or at home through a VPN. The user can use defaulted statistical and ratio values to identify the regulated gene set or they can be modified to be more or less restrictive. Once a gene set is identified, a user generated annotation process is initiated to mesh information in national databases (GO, BioCarta, GENMAPP) with user discovered information in pubmed and google searches and generate themes that the data may reflect. The annotation process can view information developed by other users and can compare their experimental results with those done by other investigators. The goal is to foster interactions across investigators, models and experimental platforms to extract as much insight from the data as possible.
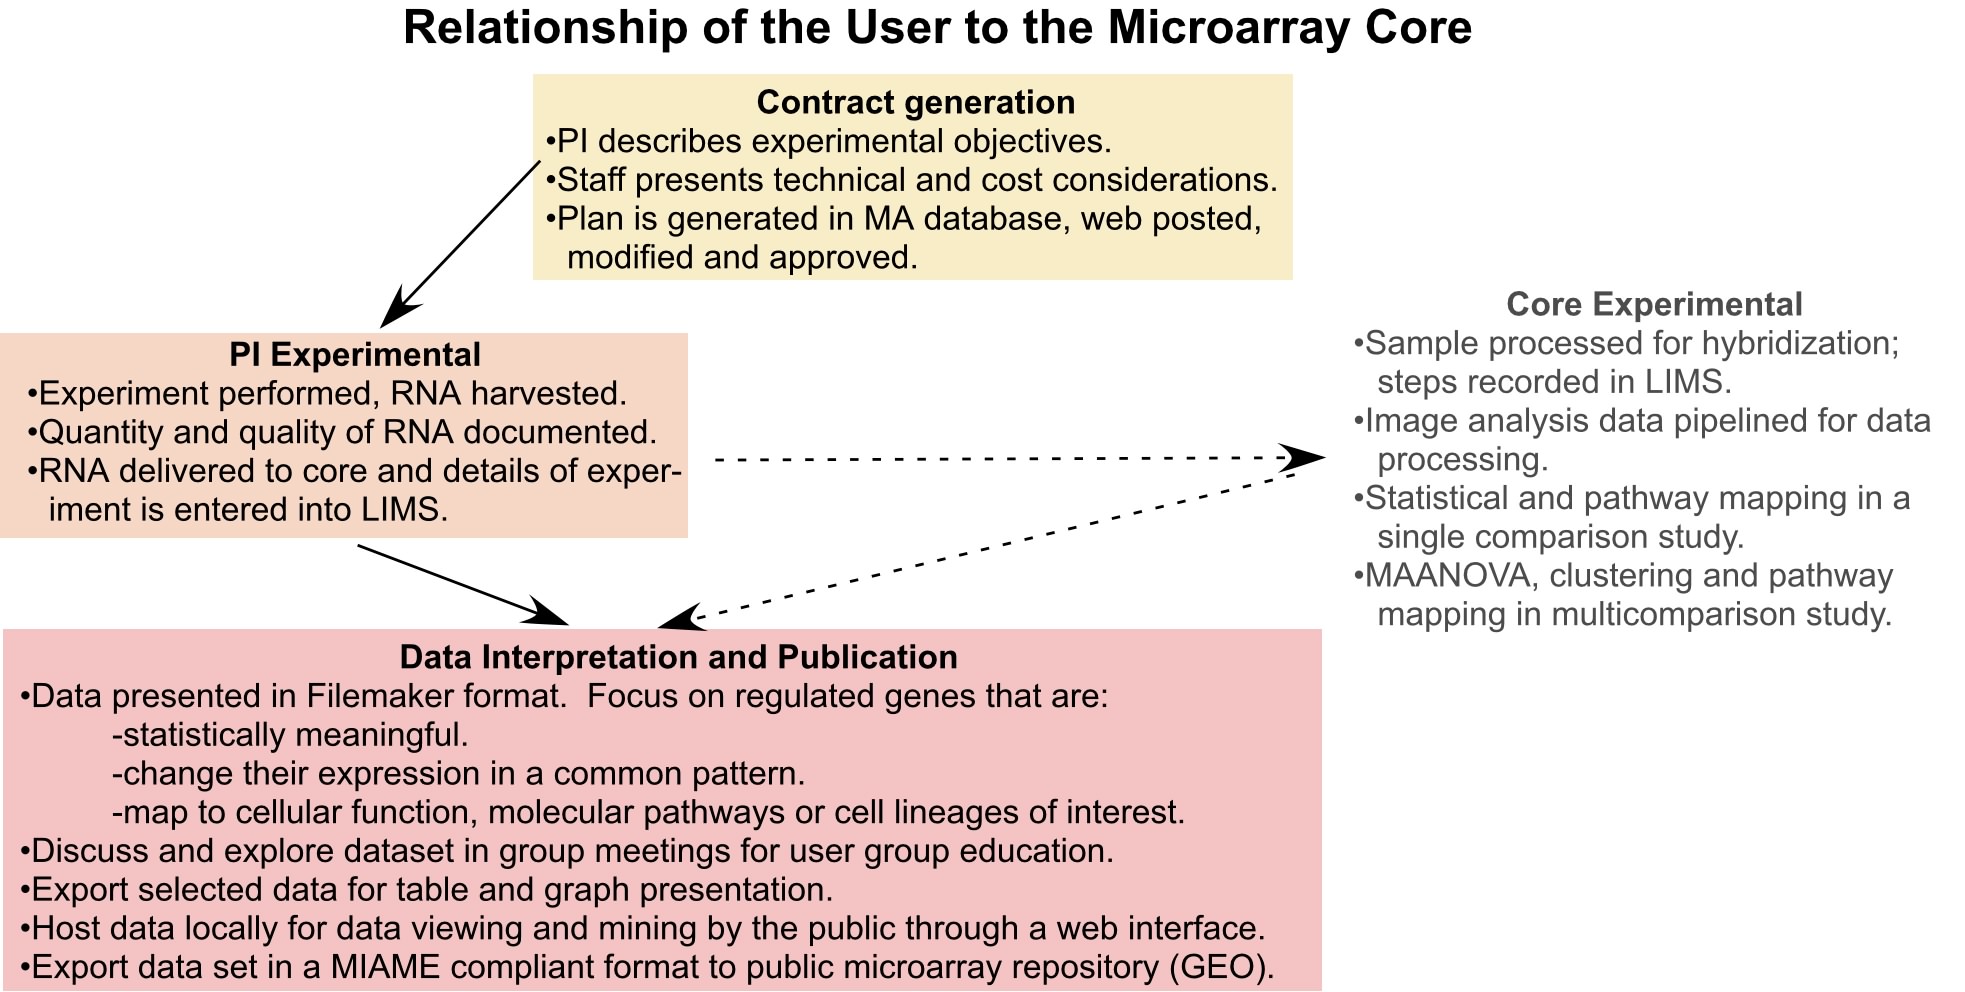
The final step in the interaction between the core and user is assistance in the publication of the microarray study. A web site has been developed that allows structured queries of the dataset ( click microarray data). Currently it host the bone progenitor microarray study, but others are being readied for web publication. The core will also supply the MIAME and raw data sets to the national microarray database repositories such as GEO. A program has be assembled that extracts the MIAMI data from the LIMS database for transmission to GEO as well as the corresponding raw intensity data stored in the Oracle database.
Estimated costs to UCHC and UCONN* users:
| Platform | Per slide Cost | Reagent Cost | No slices/exp | Service Costs | Projected cost |
| CDNA – 6K chip |
|||||
| CDNA –16K chip | |||||
| Affymetrix |
*Additional savings are given to members of the CCMD Core Center. Specific
reductions to other user groups are possible when spcific funding lines
are provided to the core’s operation.